Tuesday, August 25, 2020

2019 May (AD/AS Deflationary Gap) Paper 1 HL

 2019 May (AD/AS Deflationary Gap) Paper 1 HL


3. (a) Explain how a deflationary gap might occur.


Definition


Deflationary Gap – when the AD curve shifts left of full employment also called a recessionary gap. Actual output is below the full employment output level due to a decrease in AD. Price Level (PL) has decreased.


Diagram

Explanation


As consumer confidence in the economy falls consumers decide to spend less money on goods and serves causing AD to shift left below the full employment output level, PL decreases and output decreases and the economy to fall into a recession or a deflationary gap.


To fix a deflationary gap the appropriate Fiscal Policy would be to increase (Gs) government spending or decrease taxes causing consumers to have more income and therefore spend more increasing consumption and shofting aggregate demand back toward full employment. Monetary policy can correct a deflationary gap by inreasing the money supply causing the AD curve to shift to the right back toward full employment.


Monday, August 24, 2020

2019 (PED Indirect Tax) Paper 1 HL

 2019 (PED, Indirect Tax) 

Paper 1 HL


2. (b) Examine the significance of price elasticity of demand for the decision making of firms and governments.


Definitions

PED – a measure of the responsiveness of the quantity demanded to a change in the price along a given demand curve.


Indirect Tax = is a tax placed on the producer (produced goods and services) which is then (partly) passed on to the consumer in the form of a higher price.


Total Revenue and elasticity of a good = If the demand for a good is elastic and the firm (gov) increases the price the Qd for the good will decrease by a larger percentage than the price change causing the total revenue for the firm (gov) will decrease. If the demand for the good is inelastic and the firm (gov) increases the price the Qd for the good will decrease by a smaller percentage than the price change causing the total revenue for the firm (gov) will increase.

An indirect tax will raise the price of a good causing the supply curve to shift left and the Qd to decrease, there is a loss of Consumer Surplus and Producer Surplus and DWL. Usually if there is an indirect tax consumers and producers will share the tax meaning that some of the tax will be paid for by consumers while some will also be paid for by the producers. 


Of course the producers would like to make the consumer pay all of the tax but if the demand for the good is elastic and the producer forces the whole indirect tax onto the consumer the price will rise by the amount of the tax and then a larger percentage (compared to the price increase) of consumers will stop buying the product causing the firm's total revenue to decrease.


Understand that the more inelastic the demand, the people buying the good will still purchase much of it even when the price increases. This implies that if the government is trying to gain revenue by the imposition of the indirect tax it would do well to tax goods that have an inelastic price elasticity of demand. If the government is trying to stop people from consuming a product such as taxes, and the cigarettes demand is very inelastic the indirect tax must be higher than if the good has a very elastic demand to get people to forego consumption.


Answers may include:

definition of price elasticity of demand (PED), diagrams to show the relationship between PED, price changes and the total revenue offirms; the relationships between PED, the size of an indirect tax, tax incidence, quantityproduced/consumed and government tax revenue, explanations of the relationship between: PED, price changes and total revenue of firms; how PED affects government tax revenue, production/consumption and tax incidence, examples of PED proving significant for firms and governments in practice, synthesis and evaluation (examine).

  • Examination may include: the differing incidence of indirect tax on consumers and firms due to differing price elasticities, the impact of PED on the uses of tax/subsidy to address market failure, the impact of time on PED (and total revenue) when price changes, the difficulty of estimating PED values for firms, other factors affecting demand that cause a change in total revenue/tax revenue. 

  • Classic Example of government taxes destroying the yacht industry back in 1990: the government decided to make the rich pay more and decided on a 10% luxury tax all yachts produced would be effective. I think we can understand that a luxury goods elasticity of demand is fairly elastic. When the taxes were imposed the rich simply bought other goods or bought in other countries or just decided not to buy a yacht. It destroyed the boat building industry. Read below.

    https://www.washingtonpost.com/archive/business/1993/07/16/how-to-sink-an-industry-and-not-soak-the-rich/08ea5310-4a4b-4674-ab88-fad8c42cf55b/


2019 May (PED) Paper 1 HL

 2019 May (PED) Paper 1 HL


2. (a) Explain why the price elasticity of demand (PED) varies along the length of a straight-line demand curve.


Definitions

PED – a measure of the responsiveness of the quantity demanded to a change in the price along a given demand curve.


Demand Curve – a graph showing the demand for a commodity changes with a change in its price.


Graph/Diagram


Demand is price elastic in the upper sections of any linear demand curve and price inelastic in the lower half. It will be unit elastic at the midpoint.


Explanation


When the price is greater for a commodity the PED for that good will be greater than 1 and will be called elastic meaning that as the price increases by a percentage the quantity demanded will decrease by a greater percentage. If the price is low for the commodity the PED for the good will be relatively inelastic implying that as the price increases the quantity demanded of the good will fall by a smaller percentage than the price increase.


Example


A good example using a demand schedule, curve and actually calculating the PED change would be helpful to show what you know.

Go to the link below from 2015 paper 3 HL


https://econowaughib.blogspot.com/2020/07/2015-ped-paper-3-hl.html


Monday, August 17, 2020

2019 May (Monopoly/ Natural Monopoly) Paper 1 TZ1

 2019 May (Monopoly/ Natural Monopoly) 

Paper 1 TZ1

1 (b) Evaluate the view that monopoly is an undesirable market structure as it fails to achieve productive & allocative efficiency.


Definitions


Monopoly – Industry served by one firm.


Barriers of Entry – obstacles that prevent other firms from entering a particular industry


Allocative Efficiency – optimal quantity of goods produces based on society’s preferences (P = MC)


Productive Efficiency – production of goods at their lowest cost


Natural Monopoly – most efficient number of firms is one


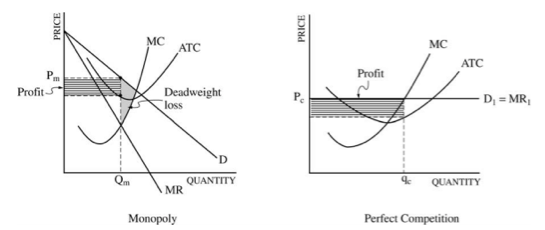
Diagram of Monopoly


A monopoly due to barriers of entry can keep competitors out of the market/industry allowing it to charge higher prices and producing less output. A monopolist given a choice will produce at profit max which is where its MR = MC (marginal revenue = marginal costs) at this point the price is greater than the MC (allocative efficiency = P = MC) and the price is greater than the minimum of the ATC (productive efficiency = P = minimum of the ATC) This is undesirable as prices are higher than society would like them to be and less output is produced causing a (DWL) dead weight loss or welfare loss to society.


In some instances monopolistic firms are desirable in that the industry they are in (electricity, transportation, water) would be better served by one firm being the producer and distributer of the service/good. Natural monopolies exist when an industry is most efficient with only one firm taking advantage of the economies of scale available. Ex. Industries with high sunk costs. Natural Monopolies tend to be forced/regulated to lower prices and produce higher output due to the fact government protection in keeping competitors at bay from entering the industries and competing with the firms. As natural monopolies take advantage of these EOS they could focus more financing toward research and development in the hopes of implementing more innovative techniques to lower costs and maintain economic profits. Of course natural monopolies could also use the government protection to be the only supplier of the good and produce low quality products and services and in extreme cases with no competition workers can become apathetic producing less output and lower qualities with no desire to maximize profits (x-inefficiency). Think of a firm with management so comfortable with the prevailing profits due to lack of competition that they hire more middle management to lighten their work load to make their work life easier will increasing costs to the company. The number of workers has increases with higher costs but output hasn’t increased.


John Hicks, who won the Nobel Prize for economics in 1972, wrote in 1935: “The best of all monopoly profits is a quiet life.” He did not mean the comment in a complimentary way. He meant that monopolies may bank their profits and slack off on trying to please their customers.

When AT&T provided all of the local and long-distance phone service in the United States, along with manufacturing most of the phone equipment, the payment plans and types of phones did not change much. The old joke was that you could have any color phone you wanted, as long as it was black. However, in 1982, government litigation split up AT&T into a number of local phone companies, a long-distance phone company, and a phone equipment manufacturer. An explosion of innovation followed. Services like call waiting, caller ID, three-way calling, voice mail through the phone company, mobile phones, and wireless connections to the internet all became available. Companies offered a wide range of payment plans, as well. It was no longer true that all phones were black. Instead, phones came in a wide variety of shapes and colors. The end of the telephone monopoly brought lower prices, a greater quantity of services, and also a wave of innovation aimed at attracting and pleasing customers.


2019 May (Output/Costs/Revenues) Paper 1 TZ1

 2019 May (Output/Costs/Revenues) Paper 1 TZ1

1.     (a) Explain the relationship between the law of diminishing returns and a firms short-run cost curves.

Definitions

Law of Diminishing Returns – as an increasing number of variable inputs (think labor) are added to at least one fixed input (think factory) marginal product first increases and then eventually decreases, or, the marginal cost first decreases and then increases.


Costs of Production – costs related to the production of a good (fixed and variable)


Specialization - the understanding that as workers specialize in each task to produce a good or service they become more efficient at the task and therefore can produce more in working together.

There of course is a optimum number of workers for efficiency and a limit, if my taco truck can only hold 5 workers then trying to stuff 10 into the truck to increase production will obviously not work as they bump into each other getrting into each others way in the production process.


Short Run – at least one variable is fixed and unchangeable (think the factory) in the short-run we can’t buy/build a larger factory (its fixed) but we can play with other variables such as more or less labor, machines etc. In the Long run we can not only change all of the labor, machines etc but we can also buy/build a larger factory.


Long Run – all variables are flexible and can be changed.


Diagrams


Explanation


Diminishing returns is the understanding that as we add more inputs (workers) to the fixed capital in the production process we will initially get an marginal (per worker) increase in production due to specialization which would cause the costs per worker to decrease as each worker is producing more output per worker but at some point if we keep hiring worker their output will start to decrease (can only have so many people working in our taco truck) as they start bumping into each other and slowing down the process and therefore causing the marginal costs to continually increase as each worker hired produces less and less.


Notice that where MP is maximized the MC is minimized – if the workers numbers are at the optimum position then they are maximizing their output per worker, adding more workers just slows down the process causing less production per worker and therefore marginal costs increase.


 Jacob Clifford does it well - https://www.youtube.com/watch?v=_TQ62MwzSrY

as does Jason Welker - https://www.youtube.com/watch?v=09sOhhoB-20


Tuesday, August 11, 2020

2019 Nov (Supply-Side, Growth) Paper 1 HL

 2019 Nov (Supply-Side, Growth) Paper 1 HL

(4) (b) Discuss the view that interventionist supply-side policies are the most effective way for a government to achieve economic growth.


Definition


Supply-Side Policies – aim at positively affecting the production side of the economy.


Interventionist Supply-Side Policies – means the government directly participates in improving the quantity and quality of factors of production to improve total productive capacity.


Economic Growth – is the increase in real output in an economy over a period of time.


Diagram


Show either an increase in both AD & LRAS or the PPC (shifting out) to show economic growth.


Interventionist Supply-Side Policies


(1)  Investment in Human Capital – The government can invest in education and training and raise the productivity level of its workers. (More educated workers tend to produce more) Ex. Singapore has focused on developing its human capital from its establishment, through mandatory education and incentives for firms to train their employees.


(2)  Investment in New Technology – The government can have policies to encourage research and development or to invest in new technology. Ex. During the Cold War era in 1960, the US invested heavily in space technology as it was falling behind the Soviet Union. Due to governmental policy, there was a rapid advance in aerospace technology.


(3)  Investment in Infrastructure – The government can invest in essential facilities and services such as roads, airports, and sewage treatment that add to the capital stock of the economy and are necessary for successful economic activities. Ex. Heavy investment in high-speed broadband networks during the dot-com bubble in the early 2000s has provided the necessary infrastructure for data-heavy internet uses today such as video-streaming and cloud computing.


(4)  Investment in Industrial Policies – The government may use targeted industrial policies to promote in key growth areas of the economy through the use of tax allowance, tax credits or subsidized lease programs. Ex. Korea and Taiwan have used active government support and directives in strategic industries (such as shipbuilding and microchip manufacturing) to drive economic growth.) The Hong Kong government has offered incentives e.g. rental subsidies to IT startups.


Strengths of Interventionist Supply-Side Policies


(1)  Addressing market failures resulting from positive externalities – Certain types of investment (such as education and infrastructure) have large positive externalities and would be unprovided under a market system. Government involvement would address the under-provision of the investments.


(2)  Creation of Employment – Most interventionist policies have an element of increased government spending and this has the dual effect of creating employment during the use of the policy (jobs provided by construction projects) and after the implementation policy (increased business demand with better roads).


(3)  Impact on Economic Growth – Investment in factors of production is essential for sustained growth in the long-term. Policies that directly increase such investment, or encourage private investment, have a positive impact on economic growth.


Weaknesses of Interventionist Supply-Side Policies


(1)  Impact on Government Budget – Interventionist policies involve higher government spending which increases the government’s budget. Increased government spending has to either come from increased taxes, selling of state owned enterprises, or raising debts.


(2)  Time Lag – It takes time to implement interventionist polices and it takes time for these policies to be fully realized. Ex. The construction of hospitals and ports obviously have benefits to society but might not be realized for a number of years.

2019 Nov (Multiplier GDP) Paper 1 HL

 2019 Nov (Multiplier GDP) Paper 1 HL

(4) (a) Explain the effect an increase in investment might have on RGDP using the Keynesian multiplier.


Definitions


RGDP – Real GDP is an inflation-adjusted measure that reflects the value of all goods and services produced in an economy in a given year (expressed in base-year prices) and are often referred to as “constant-price”, “inflation-corrected”, or “constant-dollar” GDP.

Investment – addition of capital stock to the country


Keynesian Multiplier - below


(AD to AD1 is the initial increase in investment but then the multiplier effect pushes AD to AD3. Therefore the RGDP (Real Output) also increases)


An initial increase in investment, a component of AD, leads to multiple successive increases in AD and RGDP.


Explanation – When there is an injection into the system (government expenditure, investment) incomes increase by the amount of the injection at first. However, the increase does not stop there. Assume MPC = 0.5, such that 50% of the additional household income is spent on consumption. With an initial injection of $100, total income increases by $100. The $100 is then paid out to households as factor income (wages) by firms. Household income increase by $100. As MPC is 0.5, households spend 50% of their income, which is $50 spent as consumption expenditure to firms then firms gain $50 and again pay $50 as factor income to household (workers). From the $50 income households now spend $25 on consumption.


This in essence is the Keynesian Multiplier formula 1/(1-MPC) or 1/MPS, if the MPC = 0.5 then the MPS = .5 therefore 1/.5 = 2 and the 2 is the Multiplier.


An initial increase in investment of $100 x 2 = $200 is the total income (RGDP) generated by the initial increase in income (investment) of $100.

Monday, August 10, 2020

2019 Nov (GNI) Paper 1 HL

2019 Nov (GNI) Paper 1 HL


(3) (b) Discuss whether the real gross national income (GNI) per capita of a country is a good indicator of its standard of living.


Definition


GNI - GNI is the total amount of money earned by a nation's people and businesses. It is used to measure and track a nation's wealth from year to year. The number includes the nation's gross domestic product plus the income it receives from overseas sources.

(RGNI = GNI – Inflation)


GNI = GDP + Net Income from Abroad

RGNI Per Capita – RGNI/# of citizens in the country

Nominal vs Real = Nominal is not adjusted for inflation and is measured with current prices, which are the prevailing prices at the time of measurement. However prices change over time. If there was a 10% increase in NGNI, we cannot comprehend whether the increase in nominal GNI is brought upon by an increase in output or price level. To allow meaningful comparisons over time, GNI has to be measured in real terms as RGNI, where GNI is adjusted for inflation so the price level of goods and services are held constant.

RGNI per capita is a good indicator of a standard of living such as higher average incomes leading to higher consumption, greater tax revenue for public services, less poverty.

There are limitations of using RGNI per capita to measure the standard of living such as the lack of information about the distribution of income and the composition of output, measurement problems and non-income factors (leisure time, quality of environment) affecting the well-being of the population; considerations of alternative measures such as HDI and the “green GDP” per capita; considerations of the meaning of “a standard of living”.

The Lorenz curve is a way of showing the distribution of income (or wealth) within an economy. Max O. Lorenz developed it in 1905 for representing wealth distribution. The Lorenz curve shows the cumulative share of income from different sections of the population. The 45 degree line is an economy that has zero income inequality. The further the line is away from the 45 degree the more income inequality. Recognize that the Country Z is more unequal in income that Country X.


The Gini coefficient can then be thought of as the ratio of the area that lies between the line of equality and the Lorenz curve (marked A in the diagram over the total area under the line of equality

2019 Nov (Fiscal Policy Circular Flow) Paper 3 HL

 2019 Nov (Fiscal Policy Circular Flow) Paper 3 HL

(3) (a) Explain the impact that a cut in taxes (expansionary fiscal policy) and an increase in government spending (also an increase in fiscal policy) might have on the circular flow of income.


Definition


Circular Flow of Income – demonstrates how money, goods and services flow through an economy.


(Indirect/Direct) Taxation – Taxes may be classified as direct or indirect. Direct taxes are levied on a person’s income or wealth and indirect taxes on goods and services.


Government Spending – Expenditures by the Local, State or Federal government.


Understand that as Taxes are cut (expansionary fiscal policy) disposable income increases and as Government Spending increases citizens will have more income to spend on goods and services (an decrease in taxes would be a reduction of a leakage and an increase in government spending is an injection). Therefore there will be an increase (flow of) in incomes.


2019 Nov (Monopoly) Paper 1 HL


2019 Nov (Monopoly) Paper 1 HL


Microeconomics


(2) (b) Discuss the view that barriers to entry in a monopoly will always lead to abnormal profits in the long run.


·      Definitions of barriers to entry, monopoly, abnormal (economic) profit, long run.

·      Diagram showing a monopoly realizing abnormal profit.

·      Explanation that monopoly firms can maintain monopoly profits in the long run because of barriers to entry such as economies of scale, branding and legal barriers.

·      Examples of specific barrier to entry that enable monopoly firms to make abnormal profits in the long run practice.

·      Synthesis or evaluation


Definitions


Barriers to Entry – are the constraints that keep other firms from entering a market /industry and they include (1) Resource ownership (2) Patents and copyrights (3) Government restrictions and (4) EOS/start up costs


Monopoly – when a single person or entity is the sole supplier of a good/service.


Abnormal (Economic) Profits – profit above a normal return on their investment


Long Run – all factors of production are variable.


Abnormal Profit Monopoly & Perfectly Competitive Firms

Monopoly firms do not always earn abnormal profits even with barriers to entry due to:

·      Insufficient demand of products  - (resulting from changing consumer tastes, technological obsolescence)

·      Government Regulation – governments often regulate or naturalize monopolies resulting in lower prices and profits.

·      Different Goals – monopolies often have different goals than profit maximization, such as revenue maximization, technological development.


CONTROL OF A PHYSICAL RESOURCE

Another type of natural monopoly occurs when a company has control of a scarce physical resource. In the U.S. economy, one historical example of this pattern occurred when ALCOA—the Aluminum Company of America—controlled most of the supply of bauxite, a key mineral used in making aluminum. Back in the 1930s, when ALCOA controlled most of the bauxite, other firms were simply unable to produce enough aluminum to compete.

As another example, the majority of global diamond production is controlled by DeBeers, a multi-national company that has mining and production operations in South Africa, Botswana, Namibia, and Canada. It also has exploration activities on four continents, while directing a worldwide distribution network of rough diamonds. Though in recent years they have experienced growing competition, their impact on the rough diamond market is still considerable


LEGAL MONOPOLY

For some products, the government erects barriers to entry by prohibiting or limiting competition. Under U.S. law, no organization but the U.S. Postal Service is legally allowed to deliver first-class mail. Many states or cities have laws or regulations that allow households a choice of only one electric company, one water company, and one company to pick up the garbage. Most legal monopolies are considered utilities—products necessary for everyday life—that are socially beneficial to have. As a consequence, the government allows producers to become regulated monopolies, to insure that an appropriate amount of these products is provided to consumers. Additionally, legal monopolies are often subject to economies of scale, so it makes sense to allow only one provider.


PROMOTING INNOVATION

Innovation takes time and resources to achieve. Suppose a company invests in research and development and finds the cure for the common cold. In this world of near ubiquitous information, other companies could take the formula, produce the drug, and because they did not incur the costs of research and development (R&D), undercut the price of the company that discovered the drug. Given this possibility, many firms would choose not to invest in research and development, and as a result, the world would have less innovation. To prevent this from happening, the Constitution of the United States specifies in Article I, Section 8: “The Congress shall have Power . . . To Promote the Progress of Science and Useful Arts, by securing for limited Times to Authors and Inventors the Exclusive Right to their Writings and Discoveries.” Congress used this power to create the U.S. Patent and Trademark Office, as well as the U.S. Copyright Office.


Patent

patent gives the inventor the exclusive legal right to make, use, or sell the invention for a limited time; in the United States, exclusive patent rights last for 20 years. The idea is to provide limited monopoly power so that innovative firms can recoup their investment in R&D, but then to allow other firms to produce the product more cheaply once the patent expires.


Trademark

trademark is an identifying symbol or name for a particular good, like Chiquita bananas, Chevrolet cars, or the Nike “swoosh” that appears on shoes and athletic gear. Roughly 1.9 million trademarks are registered with the U.S. government. A firm can renew a trademark over and over again, as long as it remains in active use.

copyright, according to the U.S. Copyright Office, “is a form of protection provided by the laws of the United States for ‘original works of authorship’ including literary, dramatic, musical, architectural, cartographic, choreographic, pantomimic, pictorial, graphic, sculptural, and audiovisual creations.” No one can reproduce, display, or perform a copyrighted work without permission of the author. Copyright protection ordinarily lasts for the life of the author plus 70 years.


Friday, August 7, 2020

2019 Nov (EOS) Paper 1 HL

2019 Nov (EOS) Paper 1 HL 

Microeconomics

(2)  (a) Explain how 2 types of Economies of Scale (EOS) can lead to a fall in long-run average costs.


·      Definitions of economies of scale, long run average costs.

·      Diagram to show movement along the downward-sloping portion of the long-run average cost curve.

·      Explanation of how economies of scale lead to lower average costs as a firm increases scale of production in the long-run that refers to 2 clearly different types of economies of scale, such as specialization, efficiency, marketing and indivisibities.

·      Examples of specific firms (or industries) that have possibly experienced falling long run average costs in practice because of economies of scale.

Definitions

EOS = a decrease in long-run unit costs gained by an increased level of production.

Long-Run Average Costs = all possible combinations of fixed and variable factors.


Diagram to show movement along the downward-sloping portion of the long-run average cost curve.

Explanation of how economies of scale lead to lower average costs as a firm increases scale of production in the long-run that refers to 2 clearly different types of economies of scale, such as specialization, efficiency, marketing and indivisibities.

Specialization and Division of Labor – at large scale firms can have employees specialize in specific roles, which they are best at. (Think lawyers, accountants, managers)

Bulk Buying – buying more allows for negotiation of a lower price.

Financial Economies – easier for large company to take out money with less interest, due to relationships.

Transport Economies – same amount of energy to move more stuff, so cost per item is reduced.

Large Machines – small companies can’t justify large machines, large machines can produce at lower costs.

Promotional Economies – larger companies are better at advertising with larger budgets.

Indivisibilities – the physical inability, or economic inappropriateness of running a machine or some other piece of equipment at below its operational capacity and as a result the machine would be under-utilized and the unit of average cost would be greater than if the machine were optimally employed.


Examples of specific firms (or industries) that have possibly experienced falling long run average costs in practice because of economies of scale.


Procter and Gamble (PG) is a large brand management company. The company owns more than 20 billion-dollar-brands, and another 20 or more half-billion-dollar brands, mostly in the area of consumer products. Procter and Gamble’s extensive distribution network allows it to reach over 4 billion customers, with plans to reach up to 5 billion customers in the next few years as they continue their international expansion. The company spends more money on consumer and market research than any other corporation.


Walmart (WMT) is the largest US supplier of groceries, and the largest US general retailer. They can buy in such enormous bulk, and force suppliers to accept such low prices, so they can sell at low prices to customers. Costco has been piercing Walmart’s moat by accepting a net profit margin of half of what Walmart has, in an attempt to compete on price and to grow. Amazon’s amazingly quick growth with its online retail model poses a threat as well. But the United States has the largest income inequality among any large and developed nation, and it’s also one of the only developed countries that is expected to have sustained population growth over the next several decades. Walmart, with its low prices, targets the millions of low income Americans and so even with well-performing competitors, I find it unlikely that Walmart will be dislodged from its position any time soon. I believe the next ten years will likely result in much better returns for WMT stock than the last ten years, since I expect their EPS growth to continue, and the stock is not overvalued as it was ten years ago.


United Parcel Service (UPS)

In 2002, Deutsche Post, the world’s largest logistics company, acquired DHL Express, a US-based carrier. In 2003, Deutsche Post acquired Airborne Express, an express carrier and air cargo company. The plan was to compete with UPS and FedEx in domestic US shipping. After five years and over $10 billion in losses, Deutsche Post gave up and left the US domestic shipping market. They simply couldn’t compete with the duopoly of UPS and FexEx. UPS and its rival FedEx are simply too large, and have such breadth of entrenched distribution networks, that one of the largest companies in the world couldn’t dislodge them even after a sustained effort. With the takeoff in online retailers (which need to ship individual packages all over the country), as well as the continued net losses of the United States Postal Service, I can only expect that UPS and its smaller rival FedEx will continue to grow and further strengthen their already formidable positions. UPS alone delivers over 15 million packages a day, and regularly delivers to over 200 countries and territories.