Showing posts with label Output/Costs/Revenue. Show all posts

Friday, July 31, 2020

2019 Nov (Output/Costs/Revenues) Paper 3 HL

2019 Nov (Output/Costs/Revenues) Paper 3 HL

(1)  (b) Using a fully labeled diagram, outline the relationship between marginal product (MP) and average product (AP) of labor.


Understand that as MP is above the AP it must be pulling the average (AP) up, as the marginal product intersects the AP the two are equal, when the MP is below the AP it pulls the AP down.


Think of it like this – if there is a group of people in a room and all of them are 6 feet tall – the average in the room is obviously 6 feet.


If the marginal (additional) person (MP) walks into the room and is above the average 8ft tall then the average (AP) increases.


If the marginal (additional) person (MP) walks in the room and is below the average 5ft tall then the average (AP) falls.


**Marginal product will fall (due to diminishing returns) will intersect the AP curve at its maximum, because if the MP>AP then AP increases and if MP<AP then AP will decrease.


Monday, June 15, 2020

2013 Nov (Output/Costs/Revenues) Paper 3 HL

2013 Nov (Output/Costs/Revenue) 
Paper 3 HL


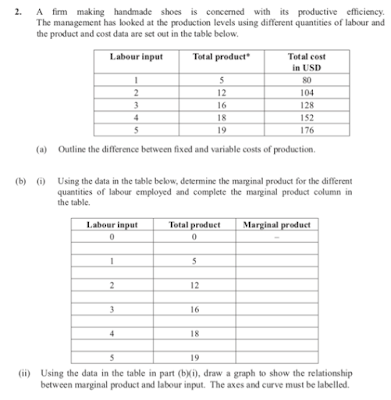
(a)   Outline the difference between fixed and variable costs of production.


Variable Costs – change with changing output (think labor) while,

Fixed costs do not change when output changes (think rent).


If you produce more you must hire more labor but no matter if you produce 1 taco or 10,000 tacos your rent for the month will not change.


(b)  (i) Using the data in the table below, determine the MP for the different quantities of labor employed and complete the MP column in the table.

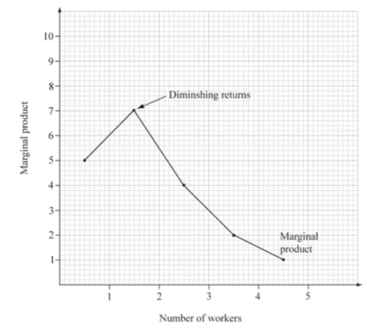
(ii) Using the data in the table in part (b) (i) draw a graph to show the relationship between marginal product and labor input. The axes and curves must be labeled.


(iii) On the graph, identify where diminishing returns set in. (3rd worker)


Vertical Axes may be (MP, Marginal Product, Output, quantity)

Horizontal Axes may be (Number of workers, Labor, L or QL)

MP points may be above or between the units of workers.


(C) State the equation used to calculate Average Total Cost: Marginal Cost


(ii) Using the data in the table, determine the marginal cost and average total cost figures for the different quantities of total product and complete the MC and ATC columns.


Recognize that when the output is 0 (zero) and there are Costs they must be fixed costs as with no production VC are zero.

FC is constant so the same all the way down

VC = TC – FC

MC = Change in TC/Change in Quantity   With 1 unit of labor (4.8  = 24/5)

ATC = TC/Q

AFC = FC/Q

AVC = VC/Q


(iii) Using the data in the table in part (c) (ii), draw a graph to show the firm’s average total cost curve. Axes and curves must be labeled.

Horizontal Axes (Output or Quantity of shoes)

Vertical Axes (Costs, average (total) costs, $)


(iv) Define the term Productive Efficiency


Productive Efficiency = P = Minimum of the ATC

Where a firm produces at the lowest unit or average total cost

(or where MC = ATC)


(d)  Explain how the law of diminishing returns affects this firm’s marginal costs.


If MP decreases then MC’s increase and vive versa and as input increases (labor) the resulting increases in output become smaller. As a result, the additional cost of one more unit of output (the MC) will begin to increase.


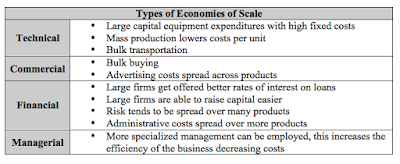
(e)  Explain one possible source of economies of scale that this firm might benefit from if it increases its scale of production.

Friday, June 12, 2020

2018 Nov (Output/Costs/Revenue) Paper 3 HL

2018 Nov (Output/Costs/Revenue) Paper 3 HL


1.     Firm A produces cartons of coffee. Figure 1 illustrates the firms total cost (TC) and variable cost (VC) at different output levels per month.


(a)  (i) Calculate Firm A’s average fixed costs when it is producing 125 cartons of coffee per month.

Recognize that the vertical distance between the TC & VC curve is the FC.


            Quantity of 125

TC = 2000

VC = 1500

TC – VC = FC

2000 – 1500 = 500 (FC)


The question is asking for Average Fixed Costs (AFC)

AFC = FC/Q


500/125 = 4 (AFC)


(ii) Calculate a Firm A’s average variable cost (AVC) when it’s producing 125 cartoons of coffee a month.


Quantity  = 125

VC = 1500

AVC = VC/Q


AVC = 1500/125 = 12 (AVC)


(b) (i) Using Figure 2, calculate the AFC when 80 cans per month are produced.


AFC is the vertical distance between the ATC & the AVC curves.

Quantity produced 80

ATC = 25

AVC = 20

AFC = ATC – AVC


AFC 5 = 25 - 20


(ii) Using Figure 2, Calculate the Total costs when 55 cans per month are produced.


The output is 55 cans so the ATC is 30


TC = ATC x Q

$1650 = 30 x 55


(iii) Explain why in the short-run, as output increases, marginal costs typically dccrease and then increase.


The Marginal Product initially tends to increase due to specialization, but then because of a fixed input (Factor of production, Fixed Capital) diminishing returns causes the MP to eventually fall and increasing the Marginal Costs.


The price of tea in the perfectly competitive tea market is presently $21 per can.


(c)  (i) Using this information, draw and label the average revenue curve on Figure 2.


(ii) Using Figure 2, identify the quantity of cans per month Firm B must produce

on order to maximize profits.


Profit Max = MR = MC

Profit Maximizing Output Level = 105


(iii) Calculate the economic profit when Firm B is producing at the output level 

identified in part (c)(ii).

If P < ATC = Loss

P – ATC (Q) = Loss

21 – 23 = 2 x 105 = -210


(d)  Sometimes a firm continues to produce in the short-run, even when it is making economic losses. Explain why.


In the short-run, the firm should continue to produce as long as the price covers (Average) variable costs, since it’s making a contribution to its fixed costs,

Or,

The firm’s losses are less than its fixed costs, so its losses would be greater if it was to shut down.


Shut-Down Point is where P = Minimum of the AVC

If the Price = the minimum of the AVC, then no fixed costs are being covered and if the price falls even lower then VC (labor) will not be able to be paid.


If my rent (a fixed cost) is $500 a month and my losses are $250 should we shut-down?

The answer is no because as long as I’m running my business I’m at least making (covering) $250 that can be paid toward my rent. If I shut down I owe the whole $500 for the rent.


Understanding – Even when making a loss I might want to keep operating as long as I’m covering some of my fixed costs (rent). If I can’t pay any of my fixed costs (rent) from running the business it’s best for the business to be shut-down.


(e)  Outline why a perfectly competitive firm is a price taker.


If the firm raises its price both the quantity sold and revenue will drop to zero and there is no reason to lower its price as it can sell all it wants at the market price.