Showing posts with label Subsidy. Show all posts

Sunday, June 7, 2020

2014#2 (Subsidy) Paper 3 HL

2014#2 Subsidy Paper 3 HL


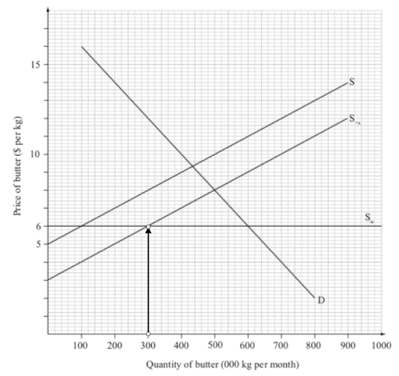
(e) The diagram above represents the market for butter in Gondowa. Domestic supply

and demand curves are given by S & D, while butter can be imported at the world price of $6/kg (Sw).


The government of Gondowa decides to grant a subsidy of $2 per kg to domestic producers of butter.


(1)           State the monthly volume of domestic production before the subsidy is granted.

Before the subsidy with a World Price of $6 domestic suppliers will only produce 100,000 units per month.


(1)           State the volume of imports before the subsidy is granted.


(1)           On the diagram, draw the new domestic supply curve for butter and label it S+s.

Remember that if you don’t label the new supply curve you can only achieve 1point maximum.


Label your curves!!!!


(4)           Calculate the level of government spending required in financing this subsidy.


At a world price of $6 and a $2 subsidy domestic producers will produce only 300,000 kg’s of butter.


300,000 x 2 = $600,000


Gov’t Spending = the final level of domestic output x subsidy per unit


At a world price of $6 and a $2 subsidy domestic producers will produce only 300,000 kg’s of butter.


300,000 x 2 = $600,000


                  Gov’t Spending = the final level of domestic output x subsidy per unit


(f) Using your answers to part (e) and your knowledge of economics, explain two disadvantages to Gondowa of the introduction of a subsidy on butter.


  • Subsidies are financed by the government (the people) $600,000 in this case so opportunity cost is involved.
  • Subsidies to domestic firms may be seen as protection and this may give rise to retaliation from trading partners.
  • Subsidies distort the pattern of trade, allowing domestic producers to survive in the face of more efficient foreign competition. Thus gains from comparative advantage will be lost, leading to reductions in efficiency.
  • Subsidies may be seen as protectionism and may give rise to sanctions from the WTO

2018#2 Nov (Subsidy) IB Paper 3 HL


2018 #2 Nov, IB Paper 3 HL

(a)   (i) Define the term social (community) surplus.


      Social Surplus/ Community Surplus is the Consumer Surplus and Producer Surplus added together.


(ii) Calculate the Community Surplus in the Market for cotton in San Marcus.


The Combination of Consumer & Producer Surplus added together equals the total Community Surplus = the area of the triangle = 16 x 50/2 = 400,000


The Government of San Marcus decides to give a subsidy of $8 to its cotton producers.


(b) (i) Draw and Label the new supply curve following the granting of the subsidy

to domestic cotton producers on Figure 3.


(b) (ii) Calculate the cost to government of San Marcos of providing this subsidy to domestic cotton producers.

The Government gives $8 to every producer of cotton for every Kg of cotton produced.

So, with the subsidy 75,000 Kg of cotton will be produced.

Therefore, 75,000 X $8 = $600,000 will be paid to cotton producers.


      (iii) Calculate the resulting change in producer surplus following the introduction of the subsidy to cotton producers in San Marcus.


(iv) Calculate the CHANGE in the consumer surplus resulting from the subsidy.


Consumer Surplus before the Subsidy = 20 – 10 = 10 (height)

At a price of $10, there will be sales of 50 (thousand Kg) (base)

Area of a Triangle is Height x Base divided by 2

So, 10 x 50 = 500/2 = 250


Consumer Surplus after the Subsidy = 20 – 5 = 15 (height)

At a price of $5, there will be sales of 75 (thousand Kg) (base)

Area of a Triangle is Height x Base divided by 2

So, 15 x 75 = 1125/2 = 562.5


The Change in consumer surplus after the subsidy is 562.5 – 250 = 312,500


(c)   Explain two reasons why the government of San Marcus may have decided to grant a subsidy to its cotton producers.


(1)  Assist buyers of cotton, as cotton subsidies will decrease production costs, (MC will shift right), the supply of cotton increases and price of cotton falls.

(2)  Assist producers (farmers) of cotton, as the profit per unit increases along with the quantity sold farmers will earn higher total revenues.

(3)  Assist the textile industry, as cotton is an input and thus when costs of production decrease textiles will be cheaper and profitability will increase.

(4)  Increase in domestic employment, as more output is produced more workers are demanded.

(5)  Increase exports (reduce imports) by making cotton more competitive in international markets.


The world price for cotton is $2 per kg. The WTO permits the government of San Marcus to maintain the $8 subsidy.


(e)   (i) Plot and label the world cotton supply curve that San Marcus now faces.


(ii) Calculate the change in the cost of financing the $8 per kg subsidy to the government of San Marcus following the decision to import cotton from the world market


(ii) -200,000,, The amount of subsidy needed by the government falls from 600,000 down to 400,000 as the world price pushes the price of the good so low that domestic suppliers will only supply 50,000 units.


Add caption