Showing posts with label Output/Costs/Revenues. Show all posts

Monday, August 17, 2020

2019 May (Output/Costs/Revenues) Paper 1 TZ1

 2019 May (Output/Costs/Revenues) Paper 1 TZ1

1.     (a) Explain the relationship between the law of diminishing returns and a firms short-run cost curves.

Definitions

Law of Diminishing Returns – as an increasing number of variable inputs (think labor) are added to at least one fixed input (think factory) marginal product first increases and then eventually decreases, or, the marginal cost first decreases and then increases.


Costs of Production – costs related to the production of a good (fixed and variable)


Specialization - the understanding that as workers specialize in each task to produce a good or service they become more efficient at the task and therefore can produce more in working together.

There of course is a optimum number of workers for efficiency and a limit, if my taco truck can only hold 5 workers then trying to stuff 10 into the truck to increase production will obviously not work as they bump into each other getrting into each others way in the production process.


Short Run – at least one variable is fixed and unchangeable (think the factory) in the short-run we can’t buy/build a larger factory (its fixed) but we can play with other variables such as more or less labor, machines etc. In the Long run we can not only change all of the labor, machines etc but we can also buy/build a larger factory.


Long Run – all variables are flexible and can be changed.


Diagrams


Explanation


Diminishing returns is the understanding that as we add more inputs (workers) to the fixed capital in the production process we will initially get an marginal (per worker) increase in production due to specialization which would cause the costs per worker to decrease as each worker is producing more output per worker but at some point if we keep hiring worker their output will start to decrease (can only have so many people working in our taco truck) as they start bumping into each other and slowing down the process and therefore causing the marginal costs to continually increase as each worker hired produces less and less.


Notice that where MP is maximized the MC is minimized – if the workers numbers are at the optimum position then they are maximizing their output per worker, adding more workers just slows down the process causing less production per worker and therefore marginal costs increase.


 Jacob Clifford does it well - https://www.youtube.com/watch?v=_TQ62MwzSrY

as does Jason Welker - https://www.youtube.com/watch?v=09sOhhoB-20


Friday, July 31, 2020

2019 Nov (Linear Demand Slope of Supply Output/Costs/Revenues Consumer Surplus) Paper 3 HL

2019 Nov 
(Linear Demand, Slope of Supply, Output/Costs/Revenues, Consumer Surplus) 
Paper 3 HL


(c) (i) Determine the slope of the market supply function for corn farmers in Nissos.


(ii) Calculate the monthly equilibrium quantity of corn in Noissos.

Equlibrium is where Qd = Qs

1. Find Price

10 - 0.5P = -2 + P
add +2 to each side
12 - 0.5P = P
add +.5P to each side
12 = 1.5P
P = 8

2. Insert P = 8 and solve Qd

Qd = 10 - 0.5P = 
10 - (0.5 (8)) = 
10 - 4 = 6
Qd = 6m at a Price of $8

3. Insert P = 8 and solve Qs

Qs = -2 + P = 
-2 + 8 = 6
Qs = 6m at a Price of $8

4. Q = 6 million

(d) (i) Plot and label Figure 1 the market demand curve and the market supply curve for corn in Nissos.
Qd = 10 - 0.5P
Step 1 - Make Qd/Qs zero and solve
Step 2 - Make P zero and solve
Step 3 - Plug in a number and solve


(ii) Draw and label the margonal revenue (MR) curve for corn for an individual farmer in Nissos on the grid below.

Understand that Perfectly Competitive firms have horizontal MR curves 
and they produce at Profit Maximization which is where the MR = MC.

(iii) Using Figure 1, calculate the consumer surplus in Nissos at the market equilibrium.


.5 x 6 (20 - 8) = $36m
1/2 x (6 x 12)
Area of Triangle = 1/2 (Base x Height)


2019 Nov (Output/Costs/Revenues) Paper 3 HL

2019 Nov (Output/Costs/Revenues) Paper 3 HL

(1)  (b) Using a fully labeled diagram, outline the relationship between marginal product (MP) and average product (AP) of labor.


Understand that as MP is above the AP it must be pulling the average (AP) up, as the marginal product intersects the AP the two are equal, when the MP is below the AP it pulls the AP down.


Think of it like this – if there is a group of people in a room and all of them are 6 feet tall – the average in the room is obviously 6 feet.


If the marginal (additional) person (MP) walks into the room and is above the average 8ft tall then the average (AP) increases.


If the marginal (additional) person (MP) walks in the room and is below the average 5ft tall then the average (AP) falls.


**Marginal product will fall (due to diminishing returns) will intersect the AP curve at its maximum, because if the MP>AP then AP increases and if MP<AP then AP will decrease.


Sunday, July 5, 2020

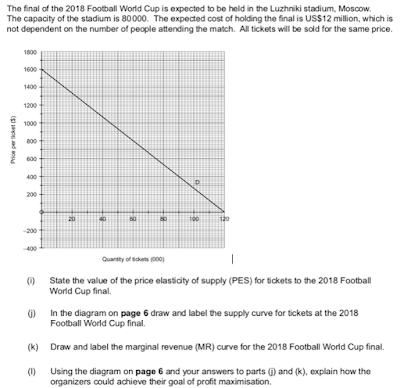
2018 May (PES, Output/Costs/Revenues) Paper 3 HL

2018 May (PES, Output/Costs/Revenues) 
Paper 3 HL


(i)            State the value of the PES for tickets to the 2018 Football World Cup final.


Value of the PES = 0 (No matter the price change the Qs will not change as there are only 80k seats)


(j) In the diagram draw and label the supply curve for tickets at the 2018 Football World Cup Final.


(k) Draw and label the marginal revenue curve for the 2018 Football final.

(i) Using the diagram on page 6, and your answers to parts (j) & (k) explain how the organizers could achieve their goal of profit maximization.

Profits are maximized where MR = MC )or where TR-TC is maximised
MC = 0 is this case (since there are no variable costs (only fixed) maximium profit will occur at the same quantity as maximum revenue = MR = 0
Profits will therefore be maximized where Q = 60,000
at a price of $800


Sunday, June 14, 2020

2013 (Output/Costs/Revenues) Paper 3 HL

2013 (Output/Costs/Revenues) 
Paper 3 HL


(a)  Complete the table above by entering the total revenue (TR), average revenue (AR), marginal revenue (MR) and the marginal cost (MC information for all levels of output.

Total Revenue = P x Q

Average Revenue = TR/Q

Marginal Revenue = Change in TR/ Change in Quantity

Marginal Cost = Change in TC/ Change in Quantity


(b)  (i) Using your answers from part (a), identify the profit maximizing level of output for the firm. You must outline the reason for your answer.


Profit max = MR = MC


Profit  = TR – TC

Max Profit is where the profit gained between TR and TC is the greatest.

The amount of profit gained between TR and TC with the 3rd unit of production is $60 (120 – 60) or the 4th unit of production $60 (140 – 80).

Either the 3rd or the 4th unit of production is where profit is maximized.


(iii) Calculate the economic profit/loss, which the firm would make at this level of output.


3 units produced TR – TC = Profit, So, 120 = 60 = $60 profit

4 units produced TR – TC = Profit, So, 140 – 80 = $60 profit


(d) The graph below illustrates the average total cost and average variable cost information for a firm.


On the graph, identify the break-even price and the shut down price for a perfectly competitive firm.


-       Drawing a horizontal line tangent to the lowest points on the AVC & ATC curves

-       Indicating the correct values or positions on the vertical axis (Break even = $7.60) & (Shut down = $6)


(e) (i) Calculate the Total variable cost if output is 50 units per month.


(e) (ii) Calculate Total Cost if output is 30 units per month.


(f) With reference to the graph in part (d), explain the difference between the break-even price and the shut down price.

Break-even price is the price at which a firm is able to just cover its average total costs while the shut down price is the price at which the firm is just able to cover its average variable costs. & In the short run a firm may stay in business even if the price is below the break-even level provided that it is greater than or equal to the minimum average variable cost so that it makes a contribution toward (covers) its fixed costs.


Saturday, June 13, 2020

2017 (Output/Costs/Revenues) Paper 3 HL

2017 (Output/Costs/Revenues) 
Paper 3 HL


(c) (i) Determine the Marginal Revenue when output is equal to 4 units.


(When TR is maximized MR = 0)

Revenue Maximization is where MR = 0

(ii) Determine, average revenue when output is equal to 6 units

AR = TR/Q

TR = 300 with 6 units produced

300/6 = $50


(iii) Determine, economic profit if output is equal to 2 units 

and average cost is equal to $130 per unit.


AC = $130 (per unit) = 130 x 2 = $260 (Total Costs)

Total Revenue for 2 units = $300

TR – TC = Profit

$300 = $260 = $40


Friday, June 12, 2020

2019 (Output/Costs/Revenues) Paper 3 HL

2019 (Output/Costs/Revenues) Paper 3 HL


(i)            Draw and label the Marginal Revenue (MR) curve for the concert on Figure 3.


(j) Calculate the maximum revenue that can be earned from selling tickets for the concert.


Max Revenue output is where MR = 0


The monopolist can choose its output or its price but not both.


The Max Rev output is 30,000 therefore the price must be 150


150 x 30,000 = $4, 500, 000


The fixed costs for the concert have been calculated as $3 million, while it’s expected that there will be no variable costs.


(k) (i) Calculate the average fixed costs per ticket if all tickets are sold.


40,000 tickets are available

Understand that a monopolist can choose its price or quantity but not both.


If they want to sell all 40k tickets the monopoly will price them at $100 each,

But they will only make 40,000 x $100 = 4,000, 000.


Quantity of tickets = 40,000

 FC = 3 million

AFC = Fixed Costs/Quantity sold


3m / 40k = 75


(i)            Assuming that event organizers aim to maximize profit, calculate the profit that will be made from the concert.


Profit Maximization is where MR = MC


In this instance there are no Variable costs therefore no Marginal Costs

Therefore MC = 0


Total Revenue (P x Q) = 30,000 x $50 = 4,500,000

Total Costs = FC = 3,000, 000

Profit = TR – TC

1,500,000 = 4,500,000 – 3, 000,000