Wednesday, June 10, 2020

2015 #1 (Perfect Competition) Paper 3 HL

2015 #1 Perfect Competition Paper 3 HL


(a)  (i) On the diagram, draw and label the average revenue curve for Firm A.


(ii) Calculate Firm A’s total revenue if it produces 180,000 units per month.


Total Revenue = price x quantity

Profit max = (MR = MC)


Price = $18 per unit

This firm produces 180,000 units of the good.

 Total revenue = $18 x 180,000 = 3,240,000


(iii) Identify Firm A’s short-run profit maximizing level of output.


Profit max = (MR = MC)


The Firms short run profit maximizing level of output (quantity) = 140,000


(iv) Identify Firm A’s short-run abnormal profits or losses at the level of output identified in part (iii)


Total Revenue – Total Costs = Profits/losses


Total Revenue = (Price x Quantity) = 18 x 140,000 = 2,520,000

Total Costs = (AC x Quantity) = 14 x 140,000 = 1,960,000

Abnormal Profit = 2,520,000 – 1,960,000 = $560,000


(a)  With reference to the diagram, identify the long-run equilibrium price and level of output for Firm A.


P = $12

Q = 120,000


(a)  Explain, using a diagram, how Firm A will move from short-run equilibrium to long-run equilibrium.


The existence of abnormal profits of $560,000 in the short-run will attract firms into the industry.

When firms enter into the market the supply of the product increases causing the price to decrease until the firm returns to long-run equilibrium (normal profit)

When firms enter the market the supply of the good increases decreasing the price from $18 to $12, the firm returns to the long-run equilibrium making a normal profit.

Notice that as firms enter quantity for the market increases but a decrease in price causes the firms quantity to decrease.


(d)  Define the term satisficing.


The idea that a firm tries to make enough profit to

1)    Satisfy different stakeholders

2)    Pursue other objectives

3)    Because decision makers do not have the necessary information to maximize profits.


Satisficing is a decision-making strategy that aims for a satisfactory or adequate result, rather than the optimal solution.


Why would you want to only aim for a satisfactory result?

Aiming for the optimal result (maximizing) on every single decision in our day can waste energy, resources and definitely time! Also, more effort spent doesn’t necessarily mean you’ll get a more optimal result — there can be diminishing returns on effort.


Tuesday, June 9, 2020

2017#2 (Price Ceiling) Paper 3 HL

2017#2 Price Ceiling Paper 3 HL


(a)  Calculate the social surplus at the equilibrium market price.           

Social surplus (total welfare) is the consumer and producer surplus added together.

Area of a Triangle = ½ (base X height)

14 – 2 = 12 (height)

Base = 8  (000 kg)

12 x 8 = 96/2 = 48,000 kg


The Government imposes a Price Ceiling of $5 per kg.


(a)  (i) Calculate the resulting shortage in the market.


Remember that to be effective or binding

Price (Ceilings are low and Floors are high)


The Price ceiling is below the equilibrium point so it is an effective or binding Price ceiling.


At the low price of $5

9,000 kg of Rice will be demanded but at the low price of $5 only 6,000 kg will be supplied. There will be a shortage of 3,000kg.

9 – 6 = 3 (000 kg)


(ii) Calculate the change in consumer surplus after the imposition of the Price Ceiling.


The Consumer Surplus before the Price Ceiling


14 – 6 = 8 (height)

Base = 8 (000 kg)

8 x 8 = 64/2 = 32,000 kg  Consumer Surplus Before the Price Ceiling


The Consumer Surplus after the Price Ceiling


The triangle portion = 14 – 8 = 6 (height)

Base = 6

6 x 6 = 36/2 = 18 (000 kg)


The Rectangle portion = 8 – 5 = 3 (height)

Length = 6

3 x 6 = 18 (000 kg)


Add then together and recognize that the

new area of consumer surplus is 12 + 18 = 36 (000 kg)


The Change in consumer surplus was a gain of 4,000kg of Rice.


Monday, June 8, 2020

2016 (Indirect Tax) Paper 3 HL

2016 Indirect Tax Paper 3 HL


(e) (i) On the diagram, plot and label the new supply curve for sugar.


(ii) State the size of the tax per ton of sugar.

 The vertical distance is the size of the tax = $40


(iii) Calculate the producer surplus, which will be earned following the imposition of the tax.


120 – 90 = 30 (height)

Base = 150 (quantity sold)

150 x 30 = 4500/2 = 2250 (000 tons)


(iv) Determine the incidence of the tax per ton on producers of sugar in Country C.

First, Understand that the Total Amount of Consumers & Producers Tax Incidence is the Government’s Revenue (Tax Wedge). That rectangle up there is the total amount of revenue that goes to the government due to the Indirect Tax.

The Top section of the Tax Wedge is the amount of the tax that consumers will pay.

The Bottom section is the amount of tax the producer will pay. The amount each pays is known as the tax incidence.


This problem wants us to calculate the amount of tax incidence that producers have for 1 ton.


Notice that the blue square above has a height of 10 and a base of 25. This 1 square represents 1/6th of the producers tax incidence.

$10 x 25 = $250 The blue square represents $250 of tax owed to the government or the tax incidence of the producer.

We only need 1 ton of tax incidence not 25, so 250/25 = $10


The IB explains it as recognizing that $90 - $80 = $10


(f) (i) With reference to the distribution of income, distinguish between equity & equality.


Equity = refers to an income distribution which is fair.

(People get the income they deserve)


Equality = refers to income being distributed equally.

(People get the same income)


(ii) Explain, using an appropriate example, why an indirect tax might not be equitable.


Indirect taxes are regressive in that the tax represents a higher proportion of income of lower income households and therefore may be considered inequitable and unfair.

Examples, cigarettes, Vat taxes, etc


Sunday, June 7, 2020

2014#2 (Subsidy) Paper 3 HL

2014#2 Subsidy Paper 3 HL


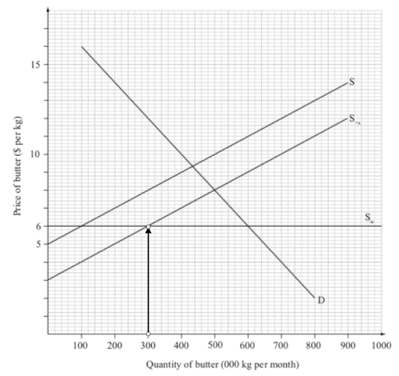
(e) The diagram above represents the market for butter in Gondowa. Domestic supply

and demand curves are given by S & D, while butter can be imported at the world price of $6/kg (Sw).


The government of Gondowa decides to grant a subsidy of $2 per kg to domestic producers of butter.


(1)           State the monthly volume of domestic production before the subsidy is granted.

Before the subsidy with a World Price of $6 domestic suppliers will only produce 100,000 units per month.


(1)           State the volume of imports before the subsidy is granted.


(1)           On the diagram, draw the new domestic supply curve for butter and label it S+s.

Remember that if you don’t label the new supply curve you can only achieve 1point maximum.


Label your curves!!!!


(4)           Calculate the level of government spending required in financing this subsidy.


At a world price of $6 and a $2 subsidy domestic producers will produce only 300,000 kg’s of butter.


300,000 x 2 = $600,000


Gov’t Spending = the final level of domestic output x subsidy per unit


At a world price of $6 and a $2 subsidy domestic producers will produce only 300,000 kg’s of butter.


300,000 x 2 = $600,000


                  Gov’t Spending = the final level of domestic output x subsidy per unit


(f) Using your answers to part (e) and your knowledge of economics, explain two disadvantages to Gondowa of the introduction of a subsidy on butter.


  • Subsidies are financed by the government (the people) $600,000 in this case so opportunity cost is involved.
  • Subsidies to domestic firms may be seen as protection and this may give rise to retaliation from trading partners.
  • Subsidies distort the pattern of trade, allowing domestic producers to survive in the face of more efficient foreign competition. Thus gains from comparative advantage will be lost, leading to reductions in efficiency.
  • Subsidies may be seen as protectionism and may give rise to sanctions from the WTO

2018#2 Nov (Subsidy) IB Paper 3 HL


2018 #2 Nov, IB Paper 3 HL

(a)   (i) Define the term social (community) surplus.


      Social Surplus/ Community Surplus is the Consumer Surplus and Producer Surplus added together.


(ii) Calculate the Community Surplus in the Market for cotton in San Marcus.


The Combination of Consumer & Producer Surplus added together equals the total Community Surplus = the area of the triangle = 16 x 50/2 = 400,000


The Government of San Marcus decides to give a subsidy of $8 to its cotton producers.


(b) (i) Draw and Label the new supply curve following the granting of the subsidy

to domestic cotton producers on Figure 3.


(b) (ii) Calculate the cost to government of San Marcos of providing this subsidy to domestic cotton producers.

The Government gives $8 to every producer of cotton for every Kg of cotton produced.

So, with the subsidy 75,000 Kg of cotton will be produced.

Therefore, 75,000 X $8 = $600,000 will be paid to cotton producers.


      (iii) Calculate the resulting change in producer surplus following the introduction of the subsidy to cotton producers in San Marcus.


(iv) Calculate the CHANGE in the consumer surplus resulting from the subsidy.


Consumer Surplus before the Subsidy = 20 – 10 = 10 (height)

At a price of $10, there will be sales of 50 (thousand Kg) (base)

Area of a Triangle is Height x Base divided by 2

So, 10 x 50 = 500/2 = 250


Consumer Surplus after the Subsidy = 20 – 5 = 15 (height)

At a price of $5, there will be sales of 75 (thousand Kg) (base)

Area of a Triangle is Height x Base divided by 2

So, 15 x 75 = 1125/2 = 562.5


The Change in consumer surplus after the subsidy is 562.5 – 250 = 312,500


(c)   Explain two reasons why the government of San Marcus may have decided to grant a subsidy to its cotton producers.


(1)  Assist buyers of cotton, as cotton subsidies will decrease production costs, (MC will shift right), the supply of cotton increases and price of cotton falls.

(2)  Assist producers (farmers) of cotton, as the profit per unit increases along with the quantity sold farmers will earn higher total revenues.

(3)  Assist the textile industry, as cotton is an input and thus when costs of production decrease textiles will be cheaper and profitability will increase.

(4)  Increase in domestic employment, as more output is produced more workers are demanded.

(5)  Increase exports (reduce imports) by making cotton more competitive in international markets.


The world price for cotton is $2 per kg. The WTO permits the government of San Marcus to maintain the $8 subsidy.


(e)   (i) Plot and label the world cotton supply curve that San Marcus now faces.


(ii) Calculate the change in the cost of financing the $8 per kg subsidy to the government of San Marcus following the decision to import cotton from the world market


(ii) -200,000,, The amount of subsidy needed by the government falls from 600,000 down to 400,000 as the world price pushes the price of the good so low that domestic suppliers will only supply 50,000 units.


Add caption