Friday, June 19, 2020

2016 (GDP/CPI) Paper 3 HL

2016 (GDP/CPI) Paper 3 HL


(a)  Calculate the Consumer Price Index (CPI) for Country A in 2016.


2015 (Basket of Goods)

5.6 x 25 + 3.45 x 18 + 1.2 x 40 + 8.40 x 5 + 2.55 x 12 = 322.70


2016 (Basket of Goods)

6.3 x 25 + 3.5 x 18 + 1.05 x 40 + 9.20 x 5 + 2.35 x 12 = 336.70


Understand that the base year CPI is 100 and the rate of change for inflation from 2015 to 2016 was 4.34%


To find the rate of change use the formula

(New – Old) / Old x 100 = (Change in Inflation)

336.70 – 322.70 / 322.70 x 100 = 4.34%


or


New/ Old x 100 = CPI in 2016

2016/ 2015 x 100 = CPI in 2016

336.70/322.70 x 100 = 104.34


(b)  State two reasons why the CPI may not accurately reflect changes in the cost of living for citizens of Country A.


·      Different income earners may experience different consumption patterns, college students would be hit harder for clothing that senior citizens and senior citizens will be hit harder by increases in medical costs.

·      Consumption patterns change frequently, if the costs of certain items increase people can switch to cheaper goods ubstitution bias

·      Wide regional differences in prices, the cost of housing in San Francisco CA, is much higher than Columbia SC.·       

·      Substitution Bias – when consumers choose to substitute one good for another after its price becomes cheaper than the good they normally buy.

·      Quality Bias – over time, technological advances increase the life and/or the usefulness of products.

·      Outlet Bias – consumers shift to new shopping areas such as wholesale clubs or online retailers that are not well represented by the CPI.


 (a)  (i) Using the data in Table 2 to support your answer, identify one year in which Country B experienced deflation and one year in which Country B experienced Disinflation.

The CPI decreased from 2008 (98) to (97) in 2009. = Deflation

Deflation  = is the sustained decrease in the Average Price Level or the idea that deflation is a decrease in the prices of goods and services.


Disinflation  = refers to a decrease in the rate of the increase of the Average Price Level or a decrease in the rate of inflation.


Disinflation was experienced between 2011 and 2012 as the rate of increase in the CPI (4.55%) was lower than the previous years inflation increase of 10%.


Remember – Rate of Change Formula  = (New-old)/ old x 100


(ii) In Country B, Nominal GDP (per capita) is $800 per month in 2010 and $940 per month in 2012. Using the CPI in Table 2 as a deflator, calculate the percentage change in the real (per capita) GDP from 2010 to 2012.


To go from Nominal to Real


The rate of inflation from 2010 (base year) to 2012 = 15%

RGDP = (NGDP/Price Index) x 100

817.39 = ($940/115) x 100


Understand that the Nominal = Real in the Base year (as there is no inflation)


Rate of Change = (New – Old) / Old x 100

2.17%   =  (817.39 - 800) / 800 x 100


(a)  Using an AD/AS diagram, explain one reason why deflation may lead to a higher level of unemployment.


Vertical Axis may be PL, APL or inflation

Horizontal Axis may be output, real output, national output, real national output, national income (Y) or GDP


2017 (GDP/CPI) Paper 3 HL

2017 (GDP/CPI) Paper 3 HL


(3) (a) Distinguish between inflation and disinflation.


Inflation – refers to a sustained increase in the Average Price Level – or the idea that inflation is an increase in the price of goods and services.


Disinflation – refers to a decrease in the rate of increase of the Average Price Level or a decrease in the rate of inflation.


(b) (i) Calculate the inflation rate for 2013 and for 2015 for Country A.


Rate of inflation formula = (New-old)/old x 100


(156.28 – 151.58) / 151.58 x 100 = 3.10


(156.07 - 158.93) / 158.93 x 100 = -1.799 or -1.80


(ii) Identify the year that Country A experienced disinflation.


2014 as the Rate of inflation in 2013 was 3.1 % while the Rate of Inflation in 2014 was 1.7% (There was an increase in inflation of 1.7% but the rate of that change was less than the previous year) = Disinflation


2015 was deflation as the PL actually decreased from the previous year.


(c) (i) The Consumer Price Index (CPI) is a weighted price index. Outline one reason why weights are used in the construction of the CPI.


Weights reflect the proportion of total spending allocated so that increased prices in goods with a larger weight lead to a more significant effect on the inflation rate than goods with a smaller weight.


Or


Increased prices are not of equal significance to the typical consumer so weights are used to reflect the relative importance of each good.


(ii) Determine the percentage change in the CPI of Country A between the base year and 2013.


Assuming that 2012 is the base year with a CPI of 100 (as the base year’s CPI is always 100) then the change in the CPI (inflation) from 2012 to 2013 was an increase in prices of 56.28%


(d) Outline how a producer price index may prove useful in predicting future inflation.


A producer price index measures the costs of bought-in raw materials and intermediary products (factors of production) and that current increases/ decreases in production costs are likely to lead to increases/decreases in consumer prices in the future.


(e) Explain two reasons why governments attempt to avoid deflation.


·      Deflation induces households to postpone purchases, further decreasing spending which in turn further decreases consumption expenditures and thus AD and leads to further decreases in real output.

·      Real debt of households/firms increases so that consumption expenditures further decrease (or banks accumulate bad loans increasing the likelihood of a bank crisis).

·      Deflation being typically caused by a fall in AD leads to an increase in cyclical unemployment.

·      The real cost of government debt servicing increases, putting pressure on other areas of government spending.

·      Deflation puts downward pressure on firms’ profits because after buying raw materials and making goods, price might have fallen below the costs of the goods/ raw materials; therefore firms are less likely to expand.

·      Higher real interest rates or lower business confidence will discourage firms from borrowing for investment projects.

Wednesday, June 17, 2020

2018 May (GDP/CPI) Paper 3 HL

2018 May (GDP/CPI) Paper 3 HL


(e) (i) Using the data in Table 3 above, calculate the level of investment.

NGDP – C – G – (X-M) = Investment

   109 – 71 – 32 – (-3) = 9 billion


or


 C + I + G + (X-M) = NGDP

 71 +? + 32 + (12-15) = 109b


(ii) State two possible reasons for the increase in investment by firms.    


(iii) The increase in investment results in both short-run and long-run effects on the economy. Draw and label the two curves that illustrate the effect.


Must show the AD curve and the LRAS curve shifting right.


Label – Label – Label


(f) Calculate the Real growth rate in 2018 using the Table 4.


2018 RGDP = 109/99.4 x 100 = (109.66 RGDP 2018)

2017 RGDP = 107/101.2 x 100 = (105.73 RGDP 2017)


Change = (New – old)/old x 100


(109.66 – 105.73) / 105.73 x 100 = 3.72%

Tuesday, June 16, 2020

2018 Nov (GDP/CPI) Paper 3 HL

2018 Nov (GDP/CPI) Paper 3 HL


(a)  Calculate GDP for Country X in 2015.

GDP = Gross Domestic Product = all final goods and services produced in the country in a year.


C = Consumption

I = Investment

G = Government Spending

Xm  = Exports – Imports


GDP = C + I + G +(X – m)


$1356 = 745 + 229 + 437 + (234 – 289)


(b)  Calculate GNI Gross National Income for Country X in 2015.


GDP + net factor income = GNI

1356 – 111 = $1245 billion


(c) Calculate the rate of consumer price inflation in 2016


Rate of Inflation Formula

(New – Old)/Old x 100


(2016 – 2015)/ 2015 x 100

(109.21 – 105.35)/105.35 x 100

      3.86/ 105.35 = .0366 x 100 = 3.66%


(d)  Using the GDP deflator, calculate the percentage change in real GDP between 2014 and 2015.


Understand that 2014 is the base year (how do I know?) the deflator and the CPI are both 100 in the base year, always.


In the base year NGDP and RGDP are the same as there is no inflation.

You are given the NGDP of 4465 and this is also the Real GDP (RGDP)


To find Real GDP the formula is


NGDP/ Price Index x 100

NGDP/ Deflator x 100 (This is the one we need)

NGDP/ CPI x 100


            4814/105.11 x 100 = (4579.96 RGDP in 2015)


            Rate of Change between 2014 & 2015 for the RGDP


(4579.96 – 4465) / 4465 x 100 = 2.57%


Monday, June 15, 2020

2013 Nov (Output/Costs/Revenues) Paper 3 HL

2013 Nov (Output/Costs/Revenue) 
Paper 3 HL


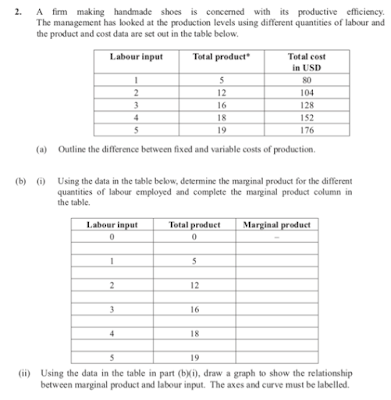
(a)   Outline the difference between fixed and variable costs of production.


Variable Costs – change with changing output (think labor) while,

Fixed costs do not change when output changes (think rent).


If you produce more you must hire more labor but no matter if you produce 1 taco or 10,000 tacos your rent for the month will not change.


(b)  (i) Using the data in the table below, determine the MP for the different quantities of labor employed and complete the MP column in the table.

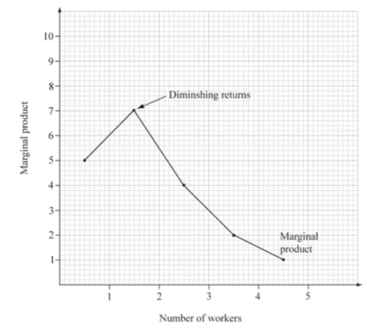
(ii) Using the data in the table in part (b) (i) draw a graph to show the relationship between marginal product and labor input. The axes and curves must be labeled.


(iii) On the graph, identify where diminishing returns set in. (3rd worker)


Vertical Axes may be (MP, Marginal Product, Output, quantity)

Horizontal Axes may be (Number of workers, Labor, L or QL)

MP points may be above or between the units of workers.


(C) State the equation used to calculate Average Total Cost: Marginal Cost


(ii) Using the data in the table, determine the marginal cost and average total cost figures for the different quantities of total product and complete the MC and ATC columns.


Recognize that when the output is 0 (zero) and there are Costs they must be fixed costs as with no production VC are zero.

FC is constant so the same all the way down

VC = TC – FC

MC = Change in TC/Change in Quantity   With 1 unit of labor (4.8  = 24/5)

ATC = TC/Q

AFC = FC/Q

AVC = VC/Q


(iii) Using the data in the table in part (c) (ii), draw a graph to show the firm’s average total cost curve. Axes and curves must be labeled.

Horizontal Axes (Output or Quantity of shoes)

Vertical Axes (Costs, average (total) costs, $)


(iv) Define the term Productive Efficiency


Productive Efficiency = P = Minimum of the ATC

Where a firm produces at the lowest unit or average total cost

(or where MC = ATC)


(d)  Explain how the law of diminishing returns affects this firm’s marginal costs.


If MP decreases then MC’s increase and vive versa and as input increases (labor) the resulting increases in output become smaller. As a result, the additional cost of one more unit of output (the MC) will begin to increase.


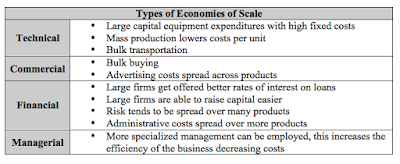
(e)  Explain one possible source of economies of scale that this firm might benefit from if it increases its scale of production.

Sunday, June 14, 2020

2013 (Output/Costs/Revenues) Paper 3 HL

2013 (Output/Costs/Revenues) 
Paper 3 HL


(a)  Complete the table above by entering the total revenue (TR), average revenue (AR), marginal revenue (MR) and the marginal cost (MC information for all levels of output.

Total Revenue = P x Q

Average Revenue = TR/Q

Marginal Revenue = Change in TR/ Change in Quantity

Marginal Cost = Change in TC/ Change in Quantity


(b)  (i) Using your answers from part (a), identify the profit maximizing level of output for the firm. You must outline the reason for your answer.


Profit max = MR = MC


Profit  = TR – TC

Max Profit is where the profit gained between TR and TC is the greatest.

The amount of profit gained between TR and TC with the 3rd unit of production is $60 (120 – 60) or the 4th unit of production $60 (140 – 80).

Either the 3rd or the 4th unit of production is where profit is maximized.


(iii) Calculate the economic profit/loss, which the firm would make at this level of output.


3 units produced TR – TC = Profit, So, 120 = 60 = $60 profit

4 units produced TR – TC = Profit, So, 140 – 80 = $60 profit


(d) The graph below illustrates the average total cost and average variable cost information for a firm.


On the graph, identify the break-even price and the shut down price for a perfectly competitive firm.


-       Drawing a horizontal line tangent to the lowest points on the AVC & ATC curves

-       Indicating the correct values or positions on the vertical axis (Break even = $7.60) & (Shut down = $6)


(e) (i) Calculate the Total variable cost if output is 50 units per month.


(e) (ii) Calculate Total Cost if output is 30 units per month.


(f) With reference to the graph in part (d), explain the difference between the break-even price and the shut down price.

Break-even price is the price at which a firm is able to just cover its average total costs while the shut down price is the price at which the firm is just able to cover its average variable costs. & In the short run a firm may stay in business even if the price is below the break-even level provided that it is greater than or equal to the minimum average variable cost so that it makes a contribution toward (covers) its fixed costs.


Saturday, June 13, 2020

2017 (Output/Costs/Revenues) Paper 3 HL

2017 (Output/Costs/Revenues) 
Paper 3 HL


(c) (i) Determine the Marginal Revenue when output is equal to 4 units.


(When TR is maximized MR = 0)

Revenue Maximization is where MR = 0

(ii) Determine, average revenue when output is equal to 6 units

AR = TR/Q

TR = 300 with 6 units produced

300/6 = $50


(iii) Determine, economic profit if output is equal to 2 units 

and average cost is equal to $130 per unit.


AC = $130 (per unit) = 130 x 2 = $260 (Total Costs)

Total Revenue for 2 units = $300

TR – TC = Profit

$300 = $260 = $40